DataLens Analytics Dashboard
Unify scattered data and see key metrics at a glance

Features
Multi-source integration
Connect ERP, CRM and spreadsheets into a single source of truth.
Interactive dashboards
Trends and anomalies stand out, with dark/light and mobile viewing.
Automated refresh
Real-time, hourly or daily refresh so no one reruns reports by hand.
Data quality checks
Automatically flag gaps and anomalies so numbers can be trusted.
A dashboard teams actually open
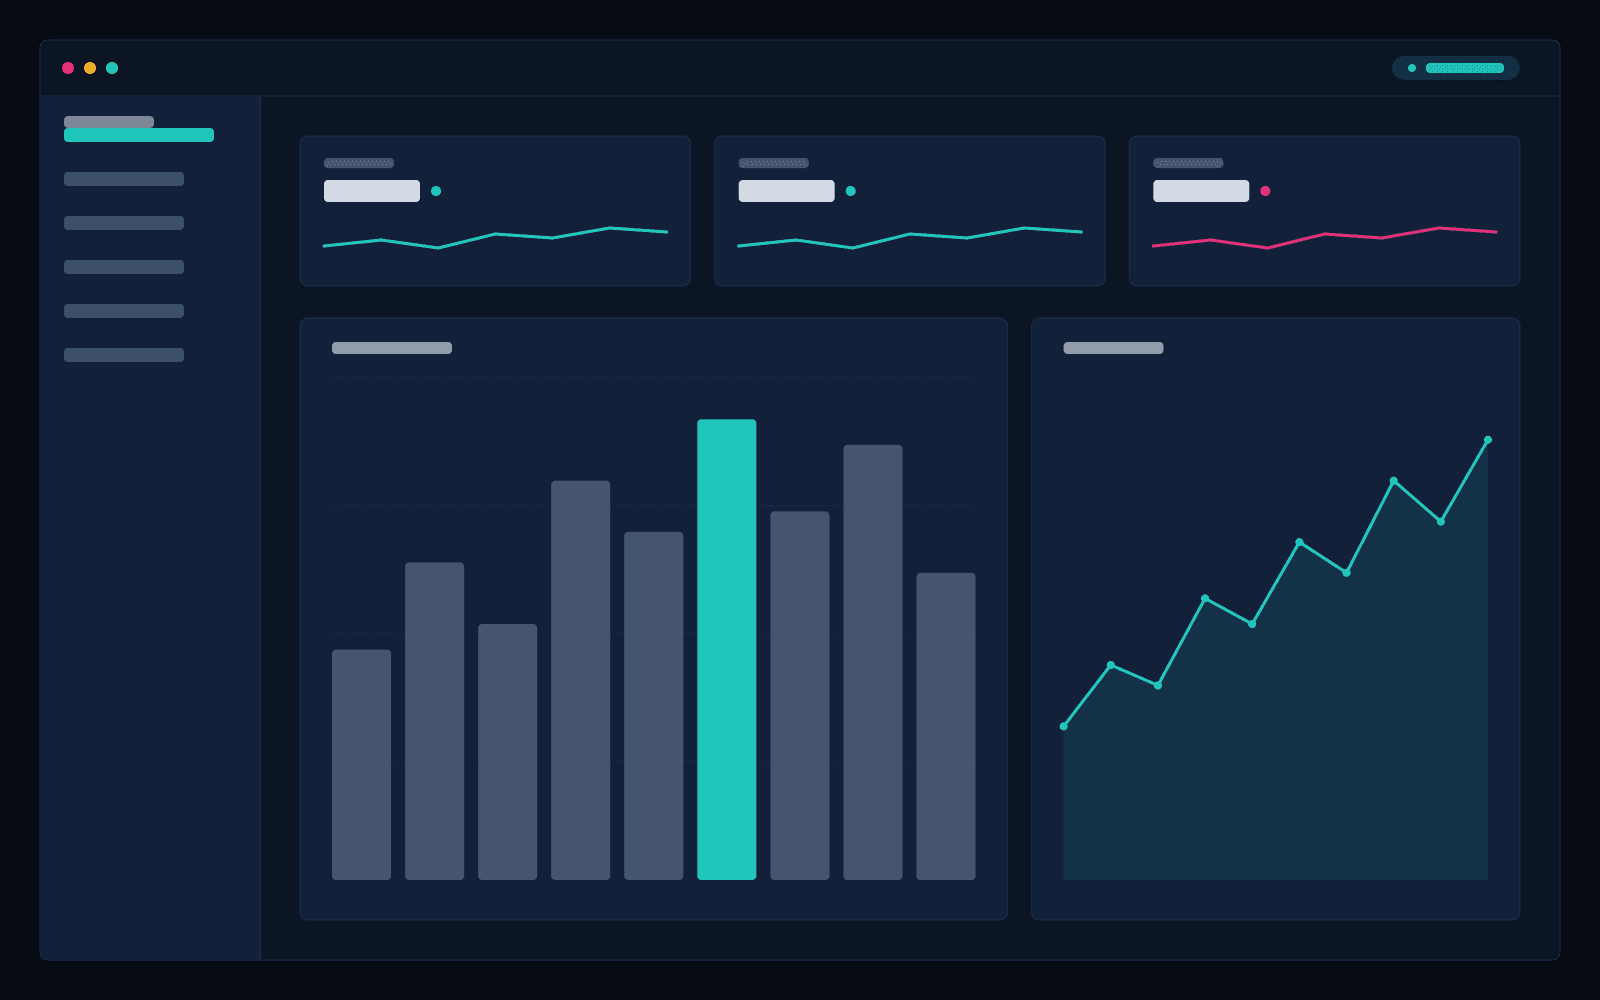
This is a read-only DataLens demo dashboard, showing consistently-defined key metrics and trend on a sample dataset. This mode is safe to share externally.
- Revenue$1.24M+12.4%
- Orders8,320+5.1%
- Avg. order value$149+2.8%
- Churn3.1%-0.6%
Sample dataset, not real customer data.
Use Cases
DataLens fits teams whose data is scattered and whose reports are still compiled by hand. Key metrics are centralized and auto-refreshed, so decisions no longer wait for a manual pull.
We clarify metric definitions and refresh cadence and build a repeatable pipeline so the numbers are consistent and traceable.
FAQ
- Can it handle messy data?
- Yes. Cleaning and integration are part of onboarding; we build a pipeline instead of a one-off manual cleanup.
- Do we need an expensive BI tool first?
- Not necessarily. We choose maintainable options based on your scale and budget.